Thursday, April 30, 2009

Under the hood

$NYAD- moved up again today so advancers were leading today.


But even with $NYAD up, $NYMO moved down again today: But notice the MACD is making a move up on the histogram.

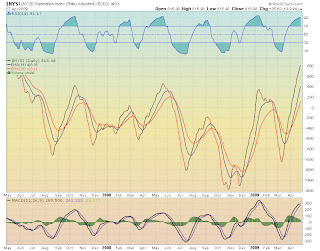
$NYSI- still moving up but the MACD has been steadily declining.

Here is one of my picks for the week and other stock I picked up:

NUS- The stock broke it's trendline earlier in the week, and was showing Bearish Divergence on the MACD I had my stopped set at 14.05 but made an executive decision to move it slightly above. It worked this time and I am still short this stock.


GEOY- is a good example of a stock breaking out of its bull flag in an uptrend. My target is 26 for this stock, it should be a 3 pt measured move.
The trend is still up in the this market and although the indicators look like they might be weakening, because of the trend the indicators can move right back up.


Sell in May and go Away?

Would you short this? Support looks strong but if the market gets to 950 in May you might want to sell and go away.


The market managed to close negative today, but no strong support was broken today. 875 maybe but the bulls defended their support levels just as the bears defended their resistance levels. The MACD on the 60 did give a sell signal and the histogram went negative.

On the daily chart 870 was held by the bulls and the market formed a shooting star candlestick pattern, which could signal a reversal. But one thing to note is the MACD went positive today, and also the trend is still up and unless the market can break the uptrend the trend is still your friend!


The dollar ran up again today making a move higher after the Economic Data this morning. 84 looks to be support for the dollar.

Levels to watch

Economic Data

8:30am March Personal Income (last -0.2%), March Personal Spending (last 0.2%), March PCE Deflator y/y (last 1.0%), March PCE Core (last m/m 0.2%, y/y 1.8%), Initial Jobless Claims (last 640K), Continuing Claims (last 6.137M)
9:45am April Chicago Purchasing Manager Index (last 31.4)
10:00am April NAPM-Milwaukee (last 30)
10:30am Natural Gas Inventories
Earnings:
XOM and PG (beat$.84 vs $.80)
Futures:
DX= down -.08 or .09% (8:08EST) Update: DX up .12 or .15% after jobless claims
Oil via /CL = up .61 1.20% (8:08EST)
/ES up 14+ or 1.58% (8:08EST)

Levels to Watch:
60 Min:
Resistance:
875 (more the likely will gap up above this)
882-884
890
900!
Support:
870
859
850

Daily:
Resistance:
875( again more then likely will gap above)
900-905( top of channel)

Support:
845-840( bottom of channel)


Wednesday, April 29, 2009

TAN and the Rising Three

Here is a example of a Rising three pattern, although the first candle is not a long up day it was still an up day.


Rising Three:


A long white day in an uptrend is followed by three relatively small candles that move opposite the overall trend but stay within the range of the first day. The fifth day is a long white day that closes above the close of the first day and continues the uptrend.

Just two wild and crazy days

What a wacky two days, the market is all over the place. Check out the headline on CNBC's website about 5 min ago so 6:20EST. Did they top tick this market!


To the market:
My post this afternoon was slightly off and I should've only made the bull flag a 12-13 point measured move, instead of a 17. Which made the high 884-886. The last 2 hours of this market were nuts.
The resistance zone I was mentioning for the past couple of days which was 875 and above has been strong resistance for this market. Notice the market is overbought on an hourly and the MACD has not been making higher highs with this market.


For the daily the bears defended 875 and held their ground. The bull flag looks to be almost completed as well. Notice how during this part of the "rally" the market has not been able to get to the upper part of the channel. This is showing some weakness.


The dollar showed some strength after the FOMC announcement today. There also appears to be a bull flag forming.


On the daily chart the dollar regained some ground it lost but was still down for the day.

Notice XLU it was up again today. Almost breaking out of the consolidation/flag pattern.


I bought some SDS today. I am still short CHIC from early in the week and long JASO from Monday and short NUS with a stop at 14.10 and long GEOY.

Possible Top

The bear flag I mention last night broke and a move to 890-892 should compelete the flag

Busy Day

The market has a busy day today, with key economic data coming out and a FOMC decision.
8:30am Advance Q1 Annualized GDP q/q (last -6.3%), Q1 GDP Price Index (last 0.5%), Q1 Personal Consumption (last -4.3%), Q1 Core PCE q/q (last 0.9%)
10:30am DoE Crude Oil/Gasoline/Distillate Inventories
1:00pm Treasury's 7-yr note auction
2:00pm FOMC rate decision

Pre-Market Notes:
/DX down again today
EUR/USD broke out of it's descending triangle

Levels to Watch:
860 to 870 on the hourly 865 has been resistance as well as 870.
865 on the daily could break the bull flag pattern and possible send the market up to 885(Chart below shows flag) 

850-840 60 min channel support for bulls
847-844 on the daily is channel support as well
854 60 Min 50 EMA
854 Weekly 20 EMA

Tuesday, April 28, 2009

Internals of the Market today


Internals were interesting today:

$NYMO- Down again today, 2 days in a row. The moving averages are moving down predominately now.


$NYAD- Ticked up today, but the power of the moves up has been weakening. Still watching for this to decline.


$NYSI- still moving up, but slowing down today was another day when it barely moved up. The MACD histogram has been declining, so this is showing divergence.


The internals are pointing to weakness, which corresponds with the market indecision/weakness lately. The key will be if these indicators follow through on the weakness and if the market can follow through. i.e does NYMO break zero, NYSI turns down or NYAD breaks the trendline, or could the move down be an opportunity to regroup and start another advance, since the market is at support levels.

The bi-polar market

Another all over the place day today.  Looking on the hourly, the go long singal was the hammer that formed in the first hour of trading.  Plus it bounced right off the orange trendline.  Then of course we have the 3:00 clock b.s stuff.  The bears defended the 860 very well today.   The bulls failed to hold the 20EMA but held the 50EMA.  The bulls were also able to defend the daily channel and the weekly 20EMA.  Seen below


On the daily, look at the channel SPX is in.  There is no reason to fight this channel.  Although the channel does look to be breaking down,  the market has not been able to get back to the top of it, and keeps touching the bottom of the channel. 


The market still is playing out the Light Blue Scenario.  But if we break the channel the Magenta scenario could play out.
The dollar was down again today it failed to get above resistance, I said 86.10 this morning should be resistance, looks like 86.20 was the resistance.   86.20 is now key resistance for the DX.  Plus we are back below the trendline.


RTH- I hate retail.  Walking around NYC this weekend I observed, everyone was shopping like there was no economic problem at all.  Apprentally UGGS are back in style because that place was packed.  Everything is on sale, so with the little dollars people have left they are buying worthless crap.  Ah the American way!
Here is a chart of RTH.  It is showing bearish divergence on the MACD and RSI.  With 80 being resistance as well.  Notice the dry up of volume!  But a break out of 80 would send this stock to at least 90.


XLU- Is a defensive sector so when it is up today it shows some sector rotation to the defensive stocks.  Watch XLU for a break out.  It could be a signal the market might turn.


LET'S GO RANGERS BIG GAME 7 TONIGHT!!!!!!!!!!!!!!!


The market really had the FLU yesterday (WORST HEADLINE EVER!!!!!)

Let's look at the market internals for yesterday, they clearly showed some sign of weakness, and the market showed this weakness as well.
$NYAD- broken down again today the moving averages are close to crossing.  The highs have gotten shorter and shorter since the rally has started.
 Here is the Cumulative $NYAD, you can see the nice trendline it has been in.  A break of this trendline would be important for the market.
 Looking at $NYMO  it turned down yesterday.  The moving averages are now starting to turn down.  Shorter-Term moving averages such as the 9 or 5 EMA are moving down steeper then the 19 and 39 EMA's.  

$NYSI- barely ticked up yesterday.  It reflects what we saw in the $NYAD and $NYMO.  Continued weakness of these two indicators will put pressure on the $NYSI. 

  Check out the cumulative $TICK chart. A more defined sell signal would be to see the TICK start a downtrend.


 MEGA- One thing to note is that $SPXA50 was acutally up yesterday


MEGA B- Decliners and the down volume won yesterday.

Based on the futures this morning the market should test some key levels in the 840's today, if the bears can hold 850 it should put some additional weakness into the market.
Key things to watch today:
845 on the 60 min- means the up channel is brokem
854 weekly 20 EMA
838 Daily 50 EMA
840 Daily level is support.

Dollar is down, EUR/USD up, Oil down


Monday, April 27, 2009

No mention of the FLU in this post just the market and charts

Resistance won today.  With the market closing below 860 and down a whole 1% the bears won today.
When the day first started out, the market was bouncing off the 20EMA.  But the market failed to get above 870.  One thing to note, is that the last 3 hour candle sticks made a Matching Low pattern, which is a bullish pattern, but the market is now below the 20EMA which is bearish.

On the daily chart, no resistance or support was broken.  The candlestick pattern that has formed is a Bullish Harmi. Currently we are still in the Light Blue Scenario, with the the possibility of drifting now to 840 for a bounce back up. 


The dollar was up 1% today vs the market being down 1%.  86.10 should a key level of resistance for the dollar. It has broken back into its ascending triangle and a break above this would signal another break of the triangle. 


Also keep and eye on the VIX.  It is close to breaking out of its triangle.  A break above 39-40 would be a strong break out.

Pikers Picks

NUS-Broke the up trendline. Stock is above 80 in the Stoch indicating overbought. MACD almost negative and crossing. Resistance above 14. Stop should be set above 14.


CASY- Stock is up against resistance and overhead supply. Big bearish divergence on the MACD as well. Short when trendline is broken.


JASO- Stock is currently trading at the bottom of it wedge and is oversold. STOCH crossed and is giving a buy signal. Stock is also sitting at the support of the 50/20 EMA's. If the 3.06 50EMA fails though stock should go to 2.67.


 GLW- This was one of my picks last week.  With earnings out today, it looks like it is going to break out of the Bull Flag.


Sunday, April 26, 2009

Levels to Watch for the week

Update: I wrote this post, this morning before the U.S Declared a Flu Emergency. Now futures are down 13points. It's very early but these support levels could be tested early this week.

The market trend is up right now, until this trend is broken the bulls(Goldman Sachs) still have full control of this market. There are more areas of support right now then resistance, so the trend favors the bulls.
The trend does seem to be weakening though.
60 Min key levels:
Bulls= 845-840. A break of this would be a break of the up channel. This would eliminate the current up trend the market is in. The next support is at 830-835.
Bears= 875-880- a move above this and the market easily goes to 900-950. There would be to much support beneath the market. Also for the bears and drop below 850 needs to be defended.


For the daily support and resistance are similar to the hourly chart.
Bulls= 840 again is the same trendline that is on the hourly. The bulls also need to defend the EMA's, as well. These have provided support already and need to again if the market wants to mantain its uptrend.

Bears= 875 and if all else fails 900.


Currently on the hourly the market is way overbought. One thing to note about this "great rally" is that the RSI has not been making new highs with the market. If you look at the RSI when the market first started to rally it would make new highs with the market. A pullback is likely from the hourly chart, but if the channel support holds it could start another move up.
Based on the current support levels, these scenarios could play out. Which I mentioned in this post. I updated the purple one since we did not go down on Friday. I also added the BLACK scenario which is a break above 880.

Friday, April 24, 2009

The market is channel surfing

Well once again the Light Blue square wins, see previous post and chart below for the squares. As I mentioned this morning if the dollar weakened the market would rally. The market was up 2% today. The dollar was down again today the EUR/USD rallied.
Here is one thing to notice-
http://online.wsj.com/mdc/public/page/2_3022-mflppg-moneyflow.html -430 came out of SPY, that is selling into strength.
SPX is clearly in an upward channel. The upper channel line has successful been defended, by the bears, while the bottom has been defended by the bulls. But looking at the overall movement of the market, the upward trend seems to be diminishing. Due to the fact the market has not been able to reach the upper channel line. The path to that channel, has some siginifcant resistance ahead of it. There is the resistance of the broken up trendline, plus resistance from the 870-880 level. But for the bulls they now have support at 850-830 plus the EMA's. It is possible that a new channel is forming, but the market will need to confirm this before I draw it on the chart, see if you can spot it.
Untill this channel is broken, the market should continue its trend upwards. I am currently flat, going into the weekend.
Enjoy the nice weather and relax tonight and in the words of Ron Burgundy
"You stay classy San Diego"

Circle Gets Center Square

Again the Light Blue squares prove to be right. Check them out on the 60 Min chart.
Looks like the market wants to fill the gap. If it breaks through there there is no stopping it till about 875. But look at the overbought condition and how this market has just ripped up. Careful if you are buying here, I wouldn't

So what's what's the scenario

Here is a chart of plausible scenarios that that could occur in the market based on support and resistance levels and the current trends.
Currently it looks like we are in a channel the trendline from the middle of April along with the 20EMA is providing support while horizontal resistance levels are providing the resistance.


Purple=SPX bounces off the up trendline that started at the end of April(hashed light blue). or the 20EMA. SPX now has a trendline and support giving the market the momentum to rally to 875 and above.

Magent= SPX follows purple but fails at the 20EMA and trendline causing a sell off.

Light Blue= Market rallies past 850 up to 875 and above failing at the grey trendline or the top of the channel. SPX falls back to the 850 and the hashed trendline, finding support and rallies back up through 875 after forming a Triple Watch and goes to the top of the channel line at 900.

Dark Green= Follows the light blue path but instead of rallying back from the 20EMA and trendline, it fails and heads lower.


The key to watch is if the market follows this channel and fails to touch the upper channel it should indicate that weakness is occurring. Also if the market does not find support at the EMA's it will show weakness. With the way the dollar has been falling, and energy going up, depending on today, I could see the Light Blue being the most likely.

Thursday, April 23, 2009

The interals of today's whipsaw

SPX ended up 1% today after a lot of whipsaw. Some indicators made some moves though to give a signal of what could occur in the next few days.

$NYMO- barely moved today, but was it key to watch is the moving averages are heading down now.


$NYAD- barely up today, the lowest move this year. And the 39 and 19 EMAs are coming closer which can bring $NYMO down. This shows with the $NYMO barely moving today.


$NYUD- Volume of the advancers is decreasing, as are the moving averages


$NYSI- If $NYAD starts falling $NYSI could turn over. The volitality of its moves has been declining for the last week.


$TICK-Actually closed negative today, but more importantly look at the 5EMA. Its heading down and almost below zero, so TICK has been declining the last 5 days


For a more brief summary, the MEGA CHARTS show the data as well. It is easier to see it on the charts by themselves.

MEGA B


MEGA