It is if almost everyone has forgot that the market has declined a long way since it's top in 2007.
So let's hit the zoom out button on some sectors here and maybe see if there is a new trend change or if the trend is still down.
XLE- Is one sector that has failed to make new high's. Notice the purple downtrend line, this has provide strong resistance. This is actually a longer-term downtrend line. XLE has support at 49.50, this is a 23.6% retracement from its high's in 08.

Zooming out- The trendline is being tested here, a break would be significant it is the last downtrend line for this sector. Notice the tight triangle forming the sweet spot is right in Sept. Also notice the support the from the 08 price at this level.

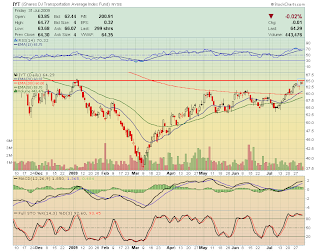
IYT- Transports, the classic Dow theory. It is testing it's high for the year and but has formed two indecision candles the last two days, closing at 64.30 and 62.29. If IYT is able to break it's 09 high's it should show support of the Dow Theory and help push along the overall market.

Zooming out- the downtrend line is far away but the index is nearing a 50% retracement and it's 2009 highs. I highlight the downtrend line and the 61% retracement. This occurs in September, a break of this level would be significant. This is around the same time as XLE's triangle sweet spot.

IYR- This sector has formed a rising bear wedge and notice the complete drop off in volume recently.

Zooming out- IYR is still in a downtrend from its 2006 highs. It has made a 23% retracement from it's highs in 2006 to low's in March. It's downtrend lines are still very far away and the next resistance is the 08 highs. Watch this sector to see if it can stay above its support levels. If it can IYR could go to it's 50% retracement.

RTH(Retail)- This chart looks actually bullish. It has a "golden cross" going, with the 50EMA crossing above the 200EMA. Notice the strong resistance at 85.

Zooming out- RTH is right at a 50% retracement from it's peak in 07. The 85 level is the down trendline from the 07 decline.

XLY- Consumer Discretionary- Touching the resistance of its July 08 lows. Two big indecision doji's the last two days. But has broken out of its high's, could be support.

Zooming out- You can see from the weekly chart it nearing resistance of its down trendline and it finally filled the gap from 9/08. $24.70 is the 32% retracement from it's 2007 high's. It has also made new highs for the year. 24.70 may provide support if there is a pullback.

XLU- Utes have been in a trending channel for the past few months and have reached the top of the channel, it is also hitting resistance via the 08 highs.

Zooming out- You can see the 08 highs are and have been resistance for a while for this sector, it is also less then a point away from its 32% retracement.

So zooming out of these sectors, you can see some of the run-up of these sectors are meeting longer-term resistance, from either 08 highs or long-term downtrendlines. Most of the run ups have successfully made retracement of 23% to 32%.
There is a possibility that there can be a pullback in these sectors but it may be shallow and these sectors could run up to till Sept, where most will meet a 50% retracement or a longer-term downtrend line. These area's may provide to strong of resistance for the sector and end this run silly run-up.