Tuesday, August 4, 2009

To a real chart

Here is the SPX hourly. 
Break it down real easy, it has a rising wedge pattern, the flag pattern it formed is completed around 1005-1010.  STOCH is nearing overbought, MACD failed to move up with this market.  That is short-term
 Here is the SPX daily chart, with the MEGA B.  One thing the bears should be worried about is first, notice the pick up in the UPVOLUME and the advancers.  This is bullish.
Also, I mentioned in late July to watch when the Down Volume gets to the green line there is a chance of a pull back.  This occured on 7/28 7/29 and SPX had the two day weak bull back. In that post I said to watch how the market reacts to a pullback; a pullback from this line may shallow since SPX is above its 200EMA.  The bullback was very shallow.  Also be aware of the EMA are turning up, and the 50EMA and 200EMA are almost crossing. Don't forget the longer-term what happen July 15th when the down volume was at .03.
The entire bear market is looking unstable here.


 Although the week just started and there is a chance of a pullback, the weekly chart has broken out of it's long-term trendline.
Again the month only started but it has now closed above it 200EMA.

These can change since it's the beginning of the week and month.

Here is the BPSPX chart, it is now above 75 and entered the B.S Zone.  Notice when it reaches these levels there is a pullback.  But also note how it can remain in this level during a bull market.

A pullback to the June high's is possible but also watch for chop in this area.  Pullbacks have been few and far between and chop has been the way to work off the overbought conditions.
One thing to still watch is the dumb dollar.  It has broken through 78 and now rest on a weak long-term trendline from Sept 08.   If this line can't hold, 76 is looking more realistic and George Washington is going to walk off the dollar. 

Monday, August 3, 2009

The Super Sonic Jet Pattern

It is very rare, only happens when the market is flooded by billions of free goverment money.  The key to recognizing the pattern is the sharp nose section of "plane" this inflicts maximum damage to the bears, you know what area.  The pattern should fail around 10,000 on the SPX when the pilot gets hypoxia. 
Good Luck and for the love of Goose STAY ABOVE THE HARD DECK

American Peso

The dollar has completely weaken and broken through any support it once has. 


The chart shows it is now below it's prior support level and nearing 78.00.  It's 3 points from it's lows in 2008.  The dollar has found support for a day or two but then has resumed it's downtrend. Till the market can find some support that last more then two days this market will keep rallying. 
Keep an eye on the 78 level for the dollar, it cannot hold this 76 may be the next stop.

Miss Celo's SPX Chart

Here are a couple of possible scenario's for the SPX, if I had the skills of being able to read into the future like Miss Celo.
I am leaning right now towards the Red line. A slight pullback to the June highs and a finally ramp up to the the downtrend line from 2007.
On a technical level the market would made a 50% retracement from its 2007 highs, it would be hitting is longer-term downtrend line and I am sure on some level it would be overbought. Also read the post below, many sectors can hit long-term resistance in September.

But on a fundemental level. I think this market runs up until late Sept or Oct, when government spending finally runs out and the powers at be can't prop the market up. Job's numbers will be worse then they are now, with unemployment at 10%+. U-6 could hit 20%. No longer can the excuses that "it's lagging" work because it is just getting worse.
People will want to know where all the jobs the stimulus money went. The wont settle for "it is taking time".
September 30th, Q2 final GDP won't be as good as last week's numbers. Then October 30th, Q3 advance GDP number will be horrible ending this run up and idea that the economy is fixed.
Why September and October you ask, because that is when people will lose the safety net of unemployment checks and will be absolutely broke.
Read today's NYTimes article, in which is discusses how come September millions will be left without there unemployment checks.
At this point people will be getting pissed, they will hear more about big financial firms raking in profits and bonuses. They will hear "analyst" and "Experts" saying the economy is doing great. Dennis Kneale would call himself a "Market Guru".
But the real people will finally see that this is bullshit, they cannot find a job and haven't been able to for almost a year and now have no money coming in.
At this point they won't care that their 401k is up this year, because they will be cashing it out so they can eat and pay their bills.
The housing market will weaken as foreclosures will finally be hitting the market now that government foreclosure extensions run out and people will have to foreclose on their homes.

It will all hit the fan at once and the Finanicals will have their bonuses and great profits. While the tax payers is broke and losing their home.

Sunday, August 2, 2009

Taking a look at the longer trends

There is a lot of hype in the market about this amazing run up from the March lows. There is talk the economy has recovered, there are green shits all over the place, jobs are only being lost at a slower rate then last month and you can just ignore revised worse GDP numbers.

It is if almost everyone has forgot that the market has declined a long way since it's top in 2007.

So let's hit the zoom out button on some sectors here and maybe see if there is a new trend change or if the trend is still down.

XLE
- Is one sector that has failed to make new high's. Notice the purple downtrend line, this has provide strong resistance. This is actually a longer-term downtrend line. XLE has support at 49.50, this is a 23.6% retracement from its high's in 08.


Zooming out- The trendline is being tested here, a break would be significant it is the last downtrend line for this sector. Notice the tight triangle forming the sweet spot is right in Sept. Also notice the support the from the 08 price at this level.


IYT- Transports, the classic Dow theory. It is testing it's high for the year and but has formed two indecision candles the last two days, closing at 64.30 and 62.29. If IYT is able to break it's 09 high's it should show support of the Dow Theory and help push along the overall market.


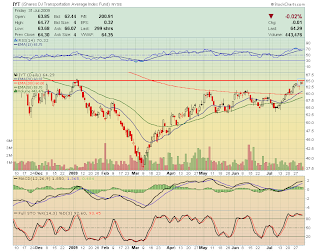
Zooming out- the downtrend line is far away but the index is nearing a 50% retracement and it's 2009 highs. I highlight the downtrend line and the 61% retracement. This occurs in September, a break of this level would be significant. This is around the same time as XLE's triangle sweet spot.


IYR- This sector has formed a rising bear wedge and notice the complete drop off in volume recently.


Zooming out- IYR is still in a downtrend from its 2006 highs. It has made a 23% retracement from it's highs in 2006 to low's in March. It's downtrend lines are still very far away and the next resistance is the 08 highs. Watch this sector to see if it can stay above its support levels. If it can IYR could go to it's 50% retracement.


RTH(Retail)- This chart looks actually bullish. It has a "golden cross" going, with the 50EMA crossing above the 200EMA. Notice the strong resistance at 85.


Zooming out- RTH is right at a 50% retracement from it's peak in 07. The 85 level is the down trendline from the 07 decline.


XLY- Consumer Discretionary- Touching the resistance of its July 08 lows. Two big indecision doji's the last two days. But has broken out of its high's, could be support.


Zooming out- You can see from the weekly chart it nearing resistance of its down trendline and it finally filled the gap from 9/08. $24.70 is the 32% retracement from it's 2007 high's. It has also made new highs for the year. 24.70 may provide support if there is a pullback.


XLU-
Utes have been in a trending channel for the past few months and have reached the top of the channel, it is also hitting resistance via the 08 highs.


Zooming out- You can see the 08 highs are and have been resistance for a while for this sector, it is also less then a point away from its 32% retracement.


So zooming out of these sectors, you can see some of the run-up of these sectors are meeting longer-term resistance, from either 08 highs or long-term downtrendlines. Most of the run ups have successfully made retracement of 23% to 32%.
The key to remember is during the latest run up the market has now made strong support levels. If the market declines these levels could provide strong bounce areas. So far all these indexes have not gone below key support levels.
There is a possibility that there can be a pullback in these sectors but it may be shallow and these sectors could run up to till Sept, where most will meet a 50% retracement or a longer-term downtrend line. These area's may provide to strong of resistance for the sector and end this run silly run-up.